In June last year this tool, which for the first time combines sub-seasonal and seasonal forecasts, was launched.
The forecasts are specially adapted to the renewable energy sector
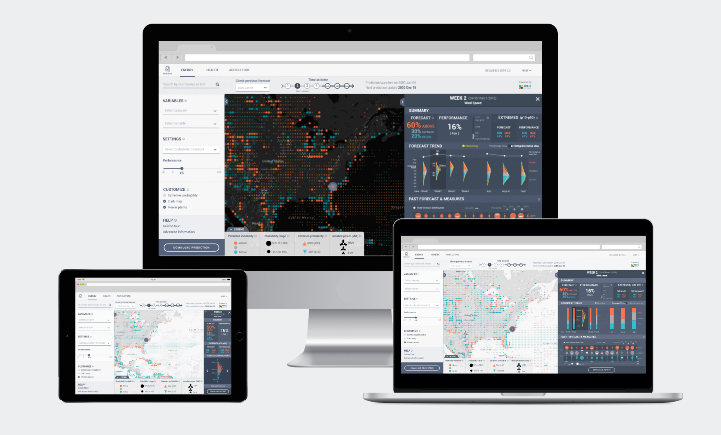
Barcelona Supercomputing Center-Centro Nacional de Supercomputación coordinates S2S4E Decision Support Tool (DST), a tool that can show, for the first time, both sub-seasonal and seasonal forecasts of rain, solar radiation, temperature, and wind adapted for the renewable energy sector. These forecasts may be checked online, and they show world-wide predictions from a week to four months in advance. This tool was launched June last year, within the framework of project S2S4E, funded by the European Union (EU).
This system allows a better preparation for extreme weather phenomena in a changing climate and could also be useful for civil protection professionals, as well as for those industries, such as agriculture, that depend on the weather. Climate change entails more extreme weather phenomena taking place, never experienced before, so one needs devices that may help us adapt to these changes.
We have asked Albert Soret, coordinator of this project and team leader of the Earth system services group in the Earth Sciences department of the BSC, to explain how it works, and what type of information it supplies.
- What is your assessment after almost a year of the implementation of the DST?
The initial objective of this work was to develop a tool to improve the prediction of renewable sources in order to increase their penetration into the energy mix. But what we have seen after almost a year working with DST is that the great effort of calculation and visualization has helped us researchers to better understand and explore predictions as well.
- What information can DST provide?
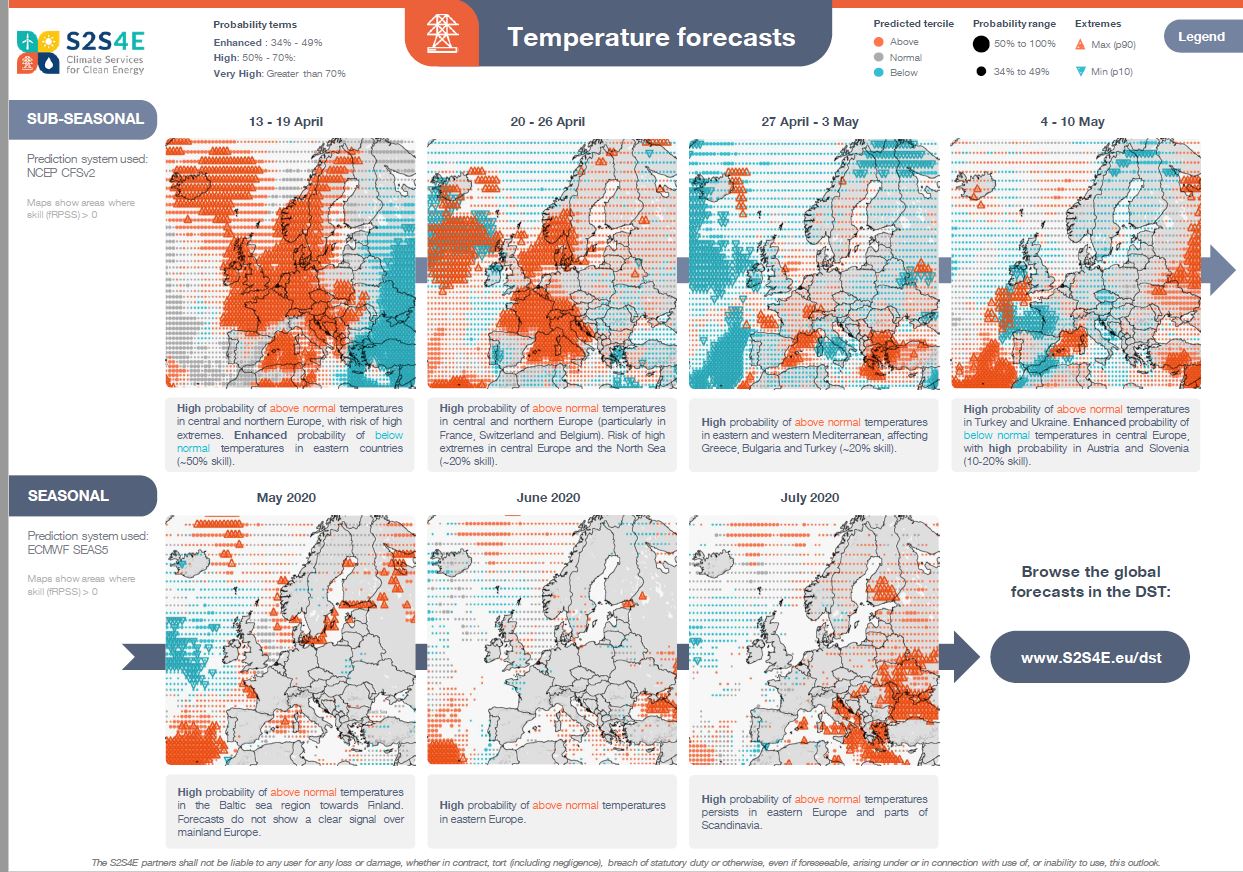
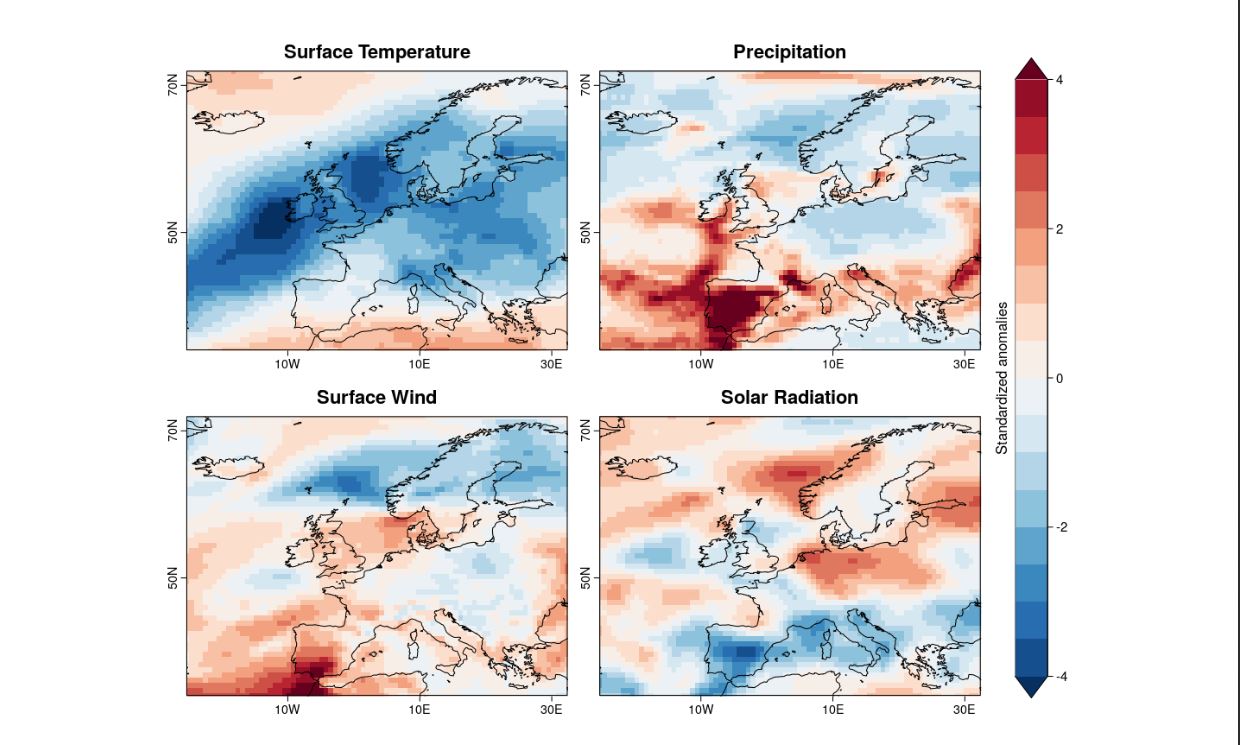
It provides forecasts for the next 4 months (first weekly forecasts for the next 4 weeks and then monthly forecasts for the next 3 months). Initially, we started giving atmospheric variables (temperature, maximum temperature, minimum temperature, rain, wind velocity, and solar radiation). Now we have begun to include indicators for the energy sector. Indicators are variables that use atmospheric information to estimate variables already “translated for the aforementioned sector”; as for example, energy demand estimated from temperature forecasts. In addition, within the DST, you can consult both the current forecast and forecasts of recent years to analyze the use of the tool in critical past periods by users.
- Which is the main novelty of this tool, with respect to others?
Nowadays, there are different initiatives that provide weekly and monthly forecasts, but never both of them combined in the same system, like DST does. Nevertheless, in the existing tools, final users of these initiatives are researchers. Information is shown in a very complicated way, and there is a huge amount of data, so it needs to be adjusted depending on the needs of different sectors potentially interested (energy, agriculture, etc.), so users may not be able to use this tool directly.
That is why the main task of DST has been to co-develop this tool directly with sector users (the partners of this project: EDPR, ENBW and EFD), as well as with other potential users (REE, RTE, Iberdrola, etc.).
- Have you introduced any changes during this time?
DST was launched in June last year, and we have been introducing different improvements in the system periodically:
- Bugs fixing and improvements in efficiency. As we are dealing with an operational system, it needs to be robust, and as we have been using it we have realised that we needed to make some adjustments in a computer level, both in the code that generates the database and feeds them to the tool, and also modifications in its visual part.
- Improvements in the methodology we have applied to make the forecasts; these enhancements are not visible for the user, but they have allowed to improve the quality of the forecasts.
- We have included new variables. As I have already said, we have started to include indicators concerning energy. This week we will start with the indicators related to hydraulic energy: a maximum anomaly in the snow cover subjected to melt in the springtime, which may increase river flows and irregularity in the flow/influx of water in river flows.
- Change in the forecast system weeks away. The project has been selected to participate in an experimental initiative to have free access to the main initiative of sub-seasonal forecasts.
- To what type of users is it addressed?
Mainly to users of energy industries, but it has also arisen the interest of other areas, such as agriculture. As regards energy, the most interested users are traders, because they systematically buy and sell electricity in different time frames. The fact of being able to better know which will be renewable production, as well as its demand, will help to fit renewables within the energy mix. We already have 735 registered users.
Study cases
Isadora Jiménez, researcher in the Earth Sciences department, explains that within the project framework study cases are being performed, with extreme cases that have affected the European energy sector during the last years. “We inform of the forecast DST would have provided, and whether it would have been useful or not. It is explained in an understandable way for energy sector professionals”.
You can consult them here.
Cold Spell in Europe “Beast of the East”, winter 2018, an example.
Last forecast here.