During the execution of synthetic and real app benchmarks, we detected that the performance of the benchmarks have a high variability on MareNostrum. Also, we were notified by other colleagues that they achieved more stable times with other apps, as FALL3D, on clusters like JUWELS. Therefore, we decided to investigate the origin of this “system noise” and the different ways to limit it, as its affects the stability of the application performance and affects negatively in the scalability, mainly in applications with synchronization MPI calls in their kernel.
Using a synthetic benchmark developed by us, we observed that there are periodic events during the simulation that affects the time of a small number of iterations. We concluded that these events come from the system and they produce preemptions on the simulation. To avoid these preemptions, we tried to run the same benchmarks leaving 1 or 2 cores per node empty. Thus, these 1 or 2 empty cores are available to run these periodic events therefore the other cores avoid the possible preemption and the applications running on them could have a more stable time per iteration.
In addition, during the PRACE UEABS activity, we noticed that some applications perform better on SkyLake systems with HyperThreading enabled, as JUWELS cluster (beyond the performance improvement acquired by the higher frequencies). This is because the systems with HyperThreading handle better the preemption and the context switching are swifter.
Taking these points into account, we decided to test multiple applications with multiple configurations, with HyperThreading and without limiting the frequency to 2,1 GHz, as others SkyLake clusters do.
Noise Benchmark (gitlab)
We developed a synthetic benchmark to quantize the effect of noise on bursts of computation with very low granularity between synchronizations. The noise is propagated through all the allocated resources when the application has such synchronization, losing CPU time proportional to the resources allocated.
The benchmark we developed simulates this behaviour and keeps track of the noise-induced load imbalance. The benchmark consists of several iterations with short bursts of computation (around 10us); that are timed and stored in an array. Ideally, all the iterations should take the same amount of time, but due to noise, some variability appears. We use the accumulated values of the minimum and maximum values among all cores for all the iterations. We take the ratio of accumulated minimums over accumulated maximums as our efficiency value.
Configuration
For the synthetic benchmark tests with hyperthreading, we used the MN4 "hyperthreading" partition. This partition has 8 nodes available (s24r2b[65-72]) with the HyperThreading enabled, and it can be used by any user using the following flag on their sbatch/salloc commands:
--partition=hyperthreading
Also, we have used the normal nodes from the "main" partition to compare. By default, all the users' jobs run on this partition.
Perfomance analysis
We wanted to compare the value of this metric on hyperthreading threads to observe if the operating system used the extra hardware thread for the preemptions so that both codes run simultaneously, reducing the effect of noise.
We executed the benchmark from 1 full node to 8 (the maximum available in the hyperthreading partition) and then plotted the results in the image below. We can observe how the normal partition has a significantly more noise effect than the hyperthreading one.
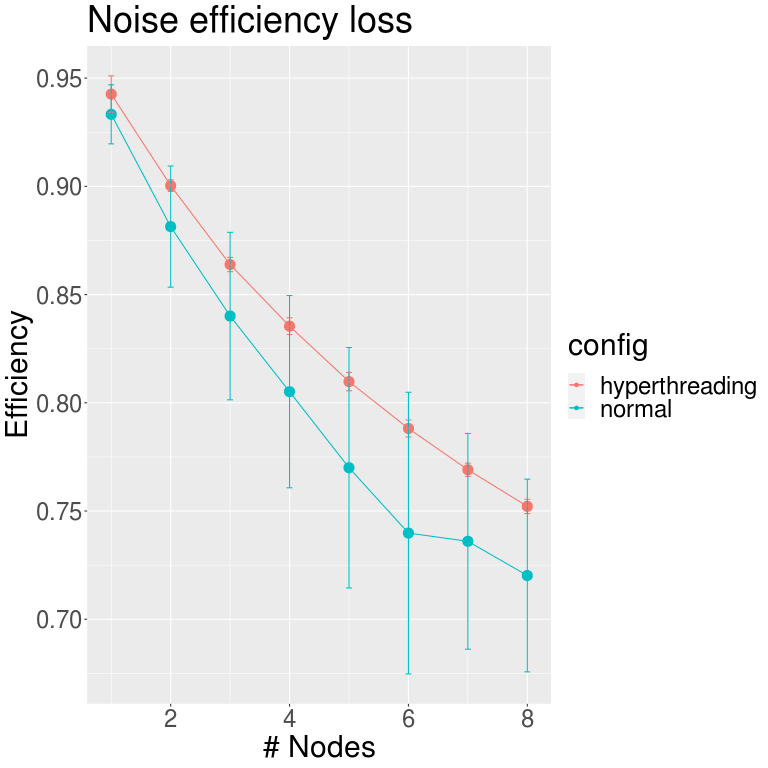
As earlier explained, these values represent the loss of efficiency when performing fine-grain synchronized computation. So from these outcomes, we can get an idea of which applications will have better behaviour in the hyperthreading partition rather than in the normal one—those with this type of communication pattern.
Applications
Configurations
All the application simulations were run on a MN4 reservation on the nodes s02r2b[25-48],s03r1b[49-72], 64 nodes in total. These nodes had set up on the following ways:
- Def (Default): Hyperthreading disabled, Frequency limited to 2,1GHz
- HT (Hyperhreading): Hyperthreading enabled, Frequency limited to 2,1GHz
- NL (NO LIMIT): Hyperthreading disabled, Frequency unlimited
- HT+NL:Hyperthreading enabled, Frequency unlimited
In some cases, for each test, we have run the same simulation with 24 and 23 tasks per socket (48 and 46 per node).
| Tests | Hyperthreading | Frequency | Tasks per socket |
|---|---|---|---|
| Def-24 | Disabled | Limited to 2,1 Ghz | 24 |
| Def-23 | Disabled | Limited to 2,1 Ghz | 23 |
| HT-24 | Enabled | Limited to 2,1 Ghz | 24 |
| HT-23 | Enabled | Limited to 2,1 Ghz | 23 |
| NL-24 | Disabled | Unlimited | 24 |
| NL | Disabled | Unlimited | 23 |
| HT+NL | Enabled | Unlimited | 24 |
| HT+NL | Enabled | Unlimited | 23 |
To run with 23 tasks per socket, we have added the following to the jobscript:
#SBATCH --ntasks-per-node=46
#SBATCH –ntasks-per-socket=23
srun –cpu-bind=core /path/to/app
Namd
- Input: 1GND
- 64 nodes (pure MPI)
| Tests | AVG | MED | STD.DEV | MIN | MAX |
|---|---|---|---|---|---|
| Def-24 | 1001,05 | 1003,57 | 11,42 | 980,47 | 1017,46 |
| Def-23 | 873,27 | 873,13 | 6,18 | 863,56 | 881,62 |
| HT-24 | 825,5 | 825,5 | 2,05 | 822,09 | 830,14 |
| HT-23 | 836,81 | 836,89 | 3,18 | 831,54 | 846,11 |
| NL-24 | 880,72 | 880,58 | 8,06 | 865,69 | 898,11 |
| NL-23 | 828,38 | 827,92 | 2,63 | 822,54 | 833,1 |
| HT+NL-24 | 766,09 | 766,57 | 3,94 | 757,85 | 774,43 |
| HT+NL-23 | 761,2 | 760,89 | 4,25 | 751,52 | 771,2 |
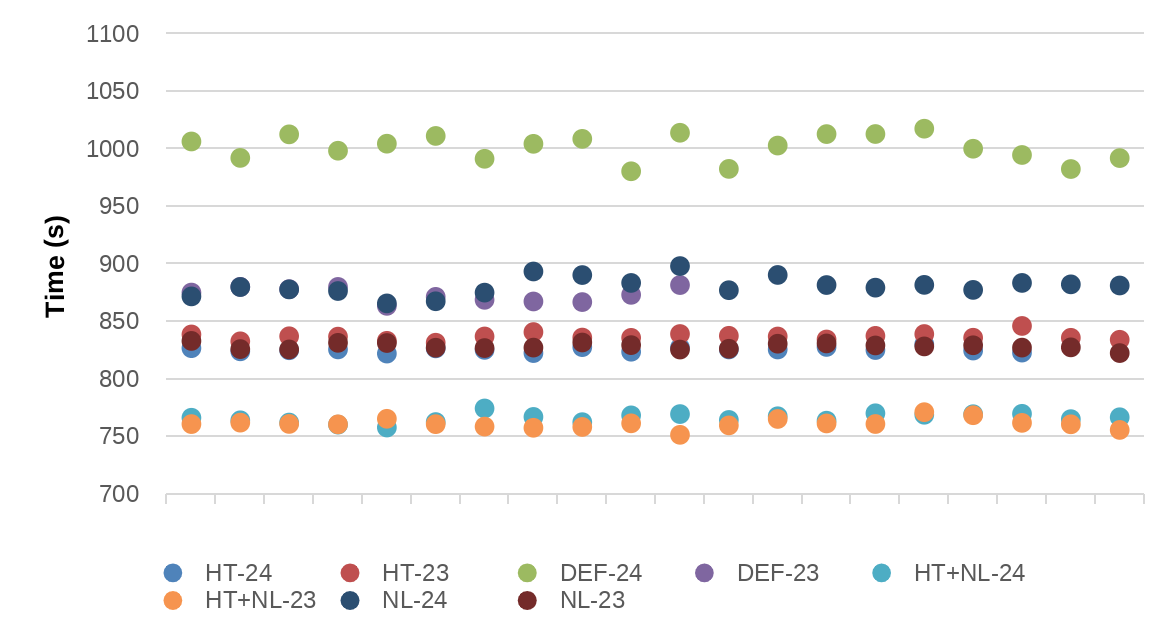
We observe that the performance of NAMD is very bad with the configuration Def-24, and it is the most common configuration used by the users. Additionally, the noise using Def-24 is higher than in other cases. The best performance is achieved using HT, without limiting the frequency and using 23 tasks per socket. In average, there is a 31,5% of speed-up of using HT+NL-23 instead of Def-24. Also, we observe that if the HT is enabled, the noise is not reduced using 23 tasks per socket instead of 24 tasks per socket.
GROMACS
- Input: Lignocellulose
- 100000 steps
- 64 nodes (Hybrid: 2 OpenMP threads per MPI task)
| Tests | AVG | MED | STD.DEV | MIN | MAX |
|---|---|---|---|---|---|
| Def-24 | 65,2 | 64,44 | 3,67 | 58,25 | 71,12 |
| Def-23 | 76,35 | 79,93 | 6,22 | 66,32 | 83,12 |
| HT-24 | 67,36 | 67,84 | 1,06 | 65,22 | 68,47 |
| HT-23 | 63,41 | 63,3 | 0,76 | 62,28 | 65,09 |
| NL-24 | 77,85 | 79,03 | 4,09 | 72,64 | 82,94 |
| NL-23 | 72,88 | 68,83 | 8,75 | 58,11 | 83,14 |
| HT+NL-24 | 73,41 | 73,44 | 0,46 | 72,57 | 74,11 |
| HT+NL-23 | 67,81 | 67,99 | 0,68 | 66,39 | 68,71 |
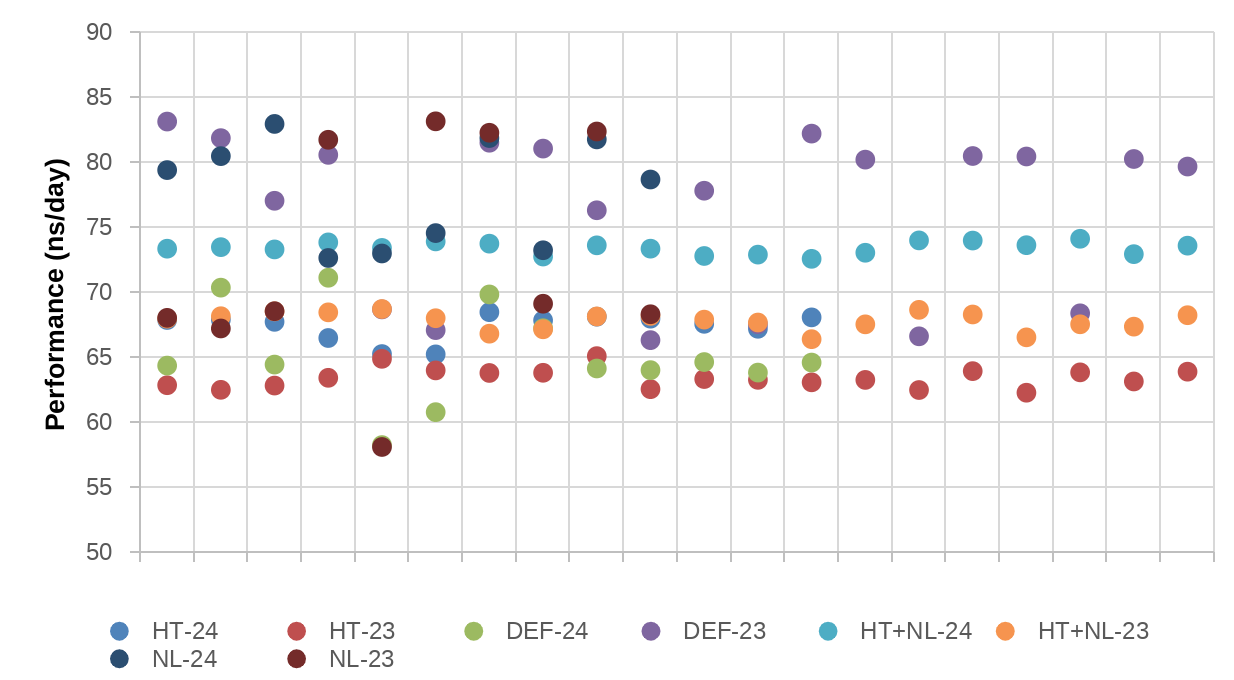
We need to take into account that in this case we are not measuring the performance with execution time, we are using ns/day (the higher the better). In the case of GROMACS, we only can confirm that with HT enabled, the noise is much lower, but the performance is the same as the Def-24 configuration. In the case of GROMACS, we do not observe a clear impact of using 23 or 24 tasks per socket.
In average, there is a 17-19% of speed-up of using Def-23 or NL-24 instead of Def-24. There is not performance loss if we use any configuration with HT, NL or combiend instead of Def-24.
CP2K
- Input: H2O-DFT-LS
- 64 nodes (Hybrid: 2 OpenMP threads per MPI task)
| Tests | AVG | MED | STD.DEV | MIN | MAX |
|---|---|---|---|---|---|
| Def-24 | 1667,45 | 1665,81 | 10,35 | 1651,53 | 1691,06 |
| HT-24 | 1797,77 | 1797,93 | 0,72 | 1796,23 | 1798,51 |
| NL-24 | 1662,52 | 1646,77 | 44,58 | 1644,33 | 1785,43 |
| HT+NL-24 | 1776,04 | 1775,59 | 2,41 | 1773,39 | 1779,82 |
On CP2K we observe a similar case as we have seen with GROMACS, the noise is much lower if the HT is enabled but the performance is lower than with the HT disabled.
Also, we observe that the noise is higher if there is no frequency limit. With NL-24 there are two outliers, but in general is quite stable and with the best performance.
There is only a 6% of speed-up using Def-24 instead of HT+NL.
WRF
- Input: IP 12km
- 64 nodes – Pure MPI
| Tests | AVG | MED | STD.DEV | MIN | MAX |
|---|---|---|---|---|---|
| Def-24 | 232,01 | 230,55 | 6,48 | 220,45 | 244,28 |
| Def-23 | 199,96 | 199,35 | 1,4 | 198,46 | 204,96 |
| HT-24 | 219,88 | 219,86 | 1,08 | 217,28 | 221,78 |
| HT-23 | 227,35 | 227,53 | 1,47 | 224,26 | 231,7 |
| NL-24 | 213,73 | 213,87 | 5,26 | 205,76 | 222,33 |
| NL-23 | 197,99 | 197,99 | 0,58 | 196,59 | 199,72 |
| HT+NL-24 | 186,75 | 186,69 | 0,91 | 184,74 | 188,97 |
| HT+NL-23 | 187,71 | 187,59 | 0,98 | 185,86 | 189,67 |
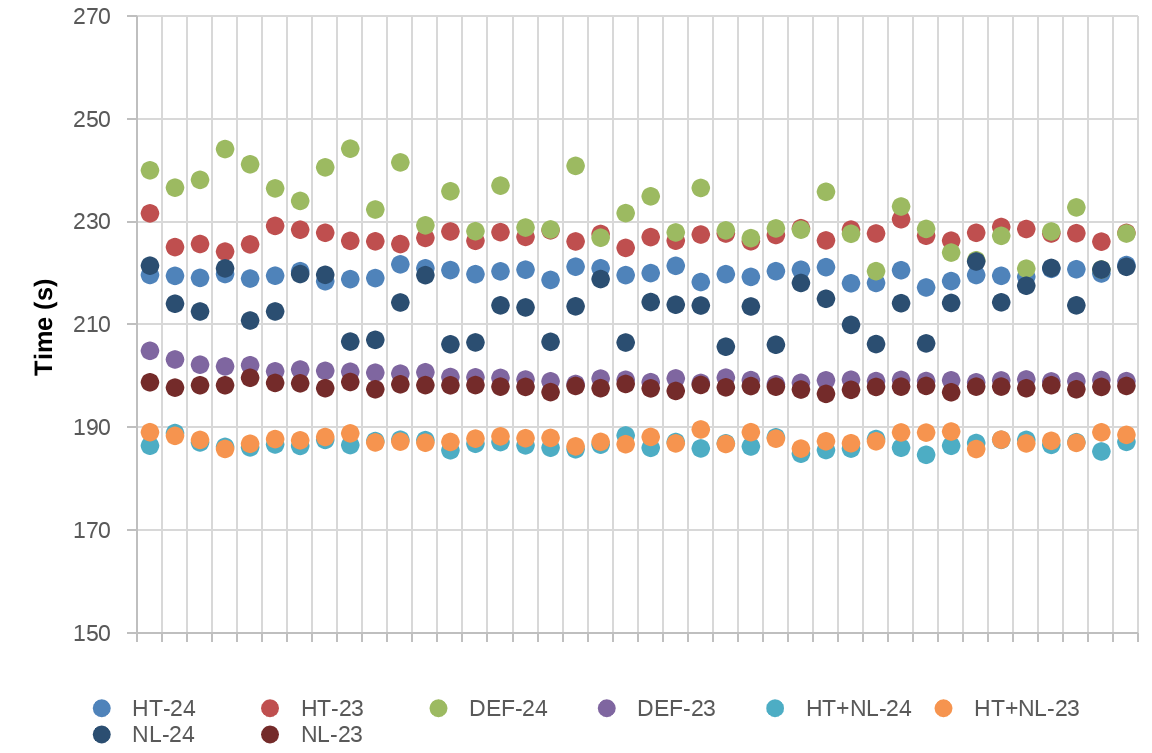
With WRF we observe a similar case as we have seen with NAMD. The worst case is the Def-24, the default configuration in MareNostrum 4 and used by all the users. Also, this configuration is the one with the higher noise impact.
The best performance of WRF is achieved with HT enabled and without frequency limit (no matter if 23 or 24 tasks per socket). In average, there is a 24% of speed-up of using HT+NL instead of Def-24. Additionally, in the case of WRF, if the HT is disabled we observe a performance improvement using 23 tasks per socket.
NEK500
- Input: JUELICH
- 64 nodes – Pure MPI
| Tests | AVG | MED | STD.DEV | MIN | MAX |
|---|---|---|---|---|---|
| Def-24 | 260,15 | 261,56 | 5,8 | 250,76 | 268,5 |
| Def-23 | 220,53 | 220,64 | 1,77 | 217,63 | 223,52 |
| HT-24 | 204,25 | 204,09 | 1,01 | 203,13 | 205,97 |
| HT-23 | 208,01 | 207,92 | 0,29 | 207,78 | 208,43 |
| HT+NL-24 | 213,12 | 213,34 | 1,75 | 210,88 | 216,08 |
| HT+NL-23 | 221,95 | 220,18 | 9,43 | 213,59 | 242,03 |
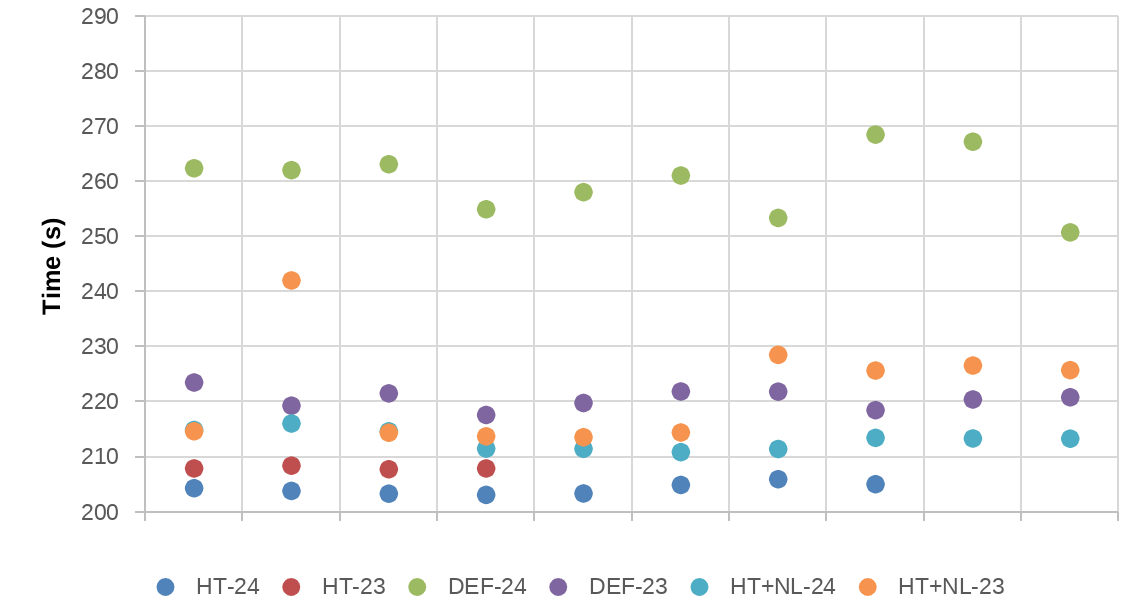
As we can see on the Table and the Figure, the worst Nek500 performance is obtained with the Def-24 configuration.
Also, we observe that the HT configurations are the ones with best performance. In this case, we see the best performance is with HT-24, but the most stable runs are with HT-23 (less noise). In average, there is a 27,4% of speed-up of using HT-24 instead of Def-24.
In the case of HT+NL, we see that NEK-500 does not benefit from removing the frequency limit.
Alya – UEABS
Test Case A
Input: SPHERE_16.7M
- 16.7M sphere mesh
- Number of steps: 50
- Mesh division: 1
100 conescutive simulations on the same job
Time measurment: Nastin Module time
| Tests | AVG | MED | STD.DEV | MIN | MAX |
|---|---|---|---|---|---|
| Def-24 | 20,19 | 19,65 | 2,14 | 16,45 | 26,21 |
| Def-23 | 17,32 | 17,5 | 0,64 | 15,38 | 18,16 |
| HT-24 | 17,61 | 17,63 | 0,68 | 15,57 | 19,3 |
| HT-23 | 18,17 | 18,29 | 0,6 | 16,44 | 19,49 |
| NL-24 | 18,57 | 18,12 | 2,07 | 15,5 | 27,7 |
| NL-23 | 17,26 | 17,42 | 0,56 | 15,48 | 18,03 |
| HT+NL-24 | 17,7 | 17,88 | 0,71 | 15,64 | 19,14 |
| HT+NL-23 | 17,72 | 17,73 | 0,76 | 15,63 | 19 |
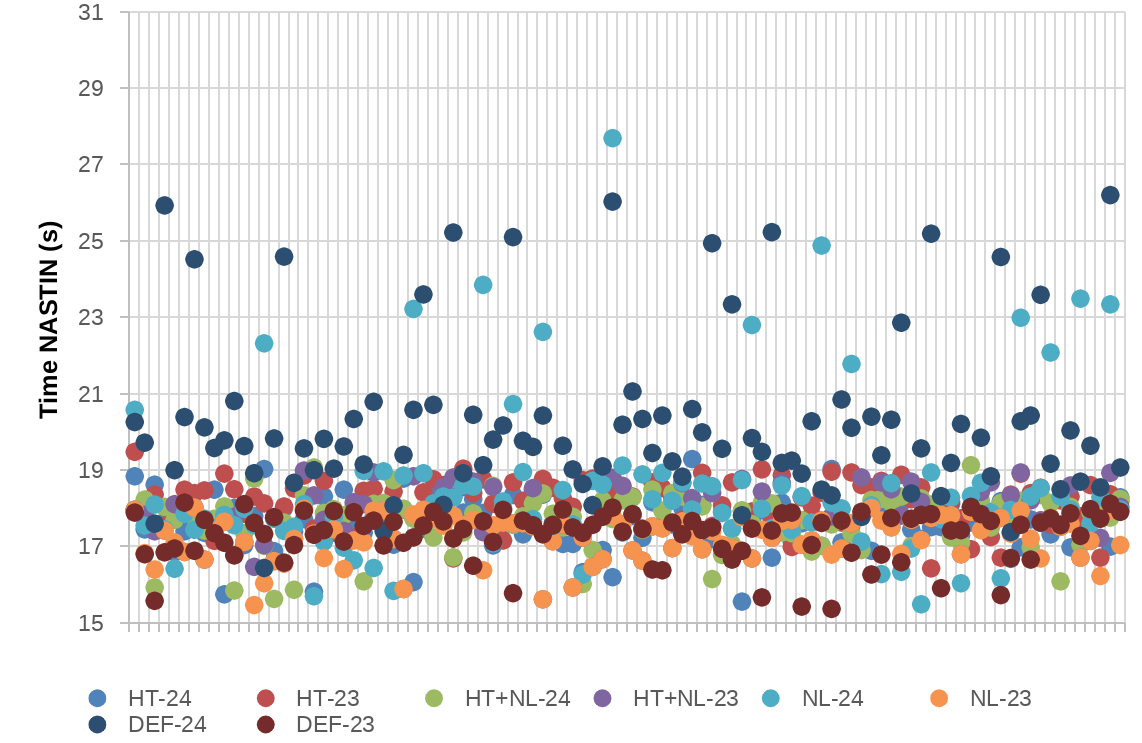
As observed in previous benchmarks, the Def-24 is the worst one in terms of average performance and the one with most noise. The noise is reduced using 23 tasks per socket and/or HT, but it is still high. In average, there is a 14% of speed-up using the HT+NL configurations instead of Def-24.
Alya – UEABS
Test Case B
Input: SPHERE_132M
- 132M sphere mesh
- Number of steps: 100
- Mesh Division: 1
100 consecutive simulations
| Tests | AVG | MED | STD.DEV | MIN | MAX |
|---|---|---|---|---|---|
| Def-24 | 444,15 | 433,46 | 32,70 | 385,32 | 555,03 |
| Def-23 | 396,44 | 390,12 | 28,30 | 351,26 | 465,40 |
| HT-24 | 402,35 | 396,06 | 26,68 | 360,93 | 471,39 |
| HT-23 | 398,23 | 392,09 | 23,85 | 360,86 | 466,12 |
| NL-24 | 441,26 | 439,27 | 28,99 | 393,93 | 531,65 |
| NL-23 | 395,72 | 390,95 | 24,24 | 357,18 | 463,74 |
| HT+NL-24 | 401,66 | 396,79 | 26,59 | 354,83 | 473,29 |
| HT+NL-23 | 401,05 | 393,55 | 25,38 | 355,09 | 473,92 |
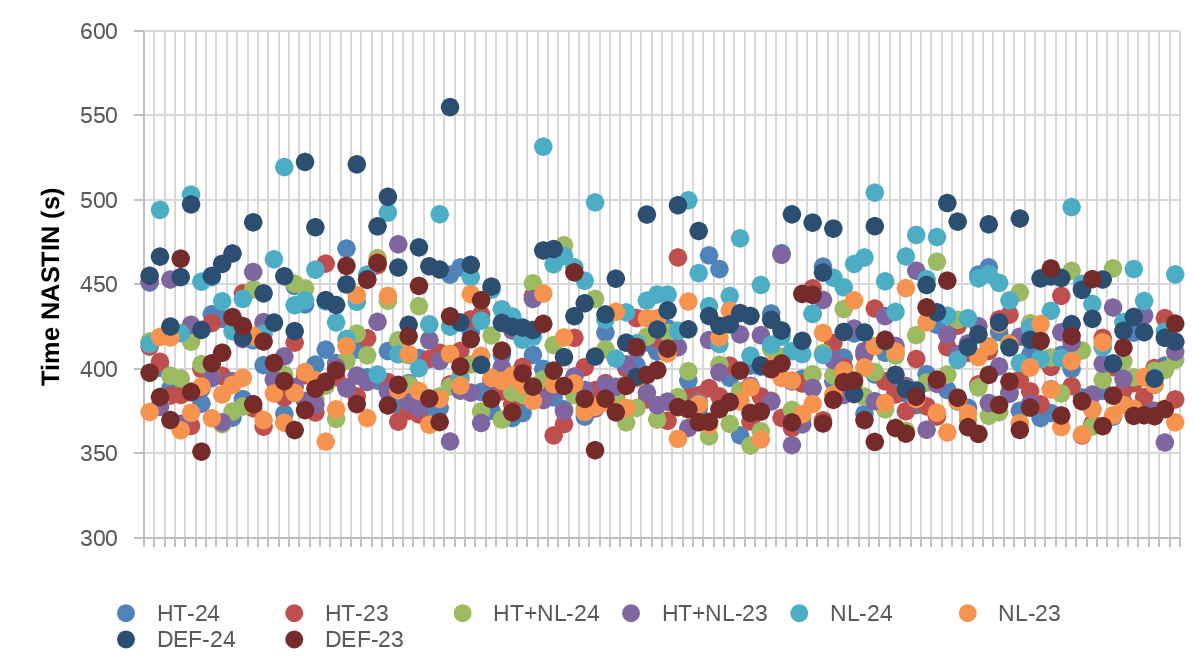
We see that Alya is positively affected using 23 tasks per socket. In the configurations with 23 tasks per socket, the performance is always better and the noise is lower. The worst performance is achieved using the Def-24 configuration, also with the most variance. In general, the best configuration is NL-23, but the fastest simulation was with Def-23.
In average, there is a 11% of speed-up using the HT+NL configurations instead of Def-24.
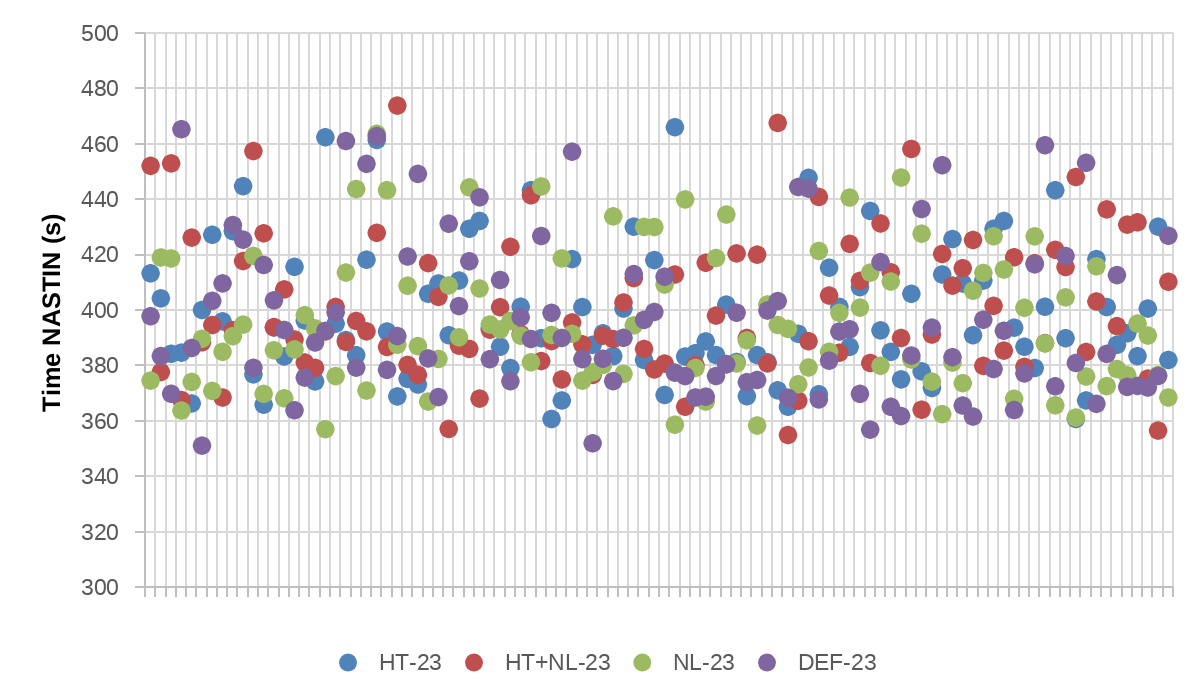
Despite of this, the test case B of Alya seems special because the variance is still high using HT and/or 23 tasks per socket.
HATE Tests
Multiple apps that run everyday on MareNostrum to check the status.
- Alya
- Amber
- CPMD
- GROMACS
- HPCG
- linpack
- namd
- vasp
- wrf
Only one simulation per tests and always running with 24 tasks per socket.
| DEF | HT | NL | HT+NL | |
|---|---|---|---|---|
| Alya | 155,18 | 152,2 | 150,01 | 152,46 |
| Amber | 470,57 | 474,29 | 470,19 | 285,08 |
| CPMD | 77,44 | 78,67 | 78,1 | 77,12 |
| GROMACS | 247 | 370,4 | 246,4 | 304,98 |
| HPCG | 120,79 | 126,06 | 126,36 | 125,5 |
| linpack | 331,44 | 337,17 | 332,03 | 343,09 |
| namd | 785,55 | 789,98 | 786,77 | 669,19 |
| vasp | 294,5 | 293,34 | 301,91 | 291,25 |
| wrf | 96,43 | 106,37 | 98,99 | 94,2 |
With the HATE benchmarks we observe a similar behavior as we have seen on the specific benchmark tests with multiple simulations. In most of the cases, the HT-NL is the best choice to obtain the best performance. Then, we observe that the performance with GROMACS is negatively affected when the HT is enabled.
Only on the synthetic benchmarks as HPCG and HPL, the performance is better with the DEF configurations.
Input/Output
| DEF | HT | NL | HT+NL | |
|---|---|---|---|---|
| Read imb_io_home | 5608,3 | 5301 | 6822 | 5537,6 |
| Read imb_io_project | 5269,4 | 5794,4 | 5632,2 | 6803,3 |
| Read imb_io_scratch | 5594,4 | 4989,3 | 6745 | 5953,2 |
| Write imb_io_home | 3653,5 | 3547,3 | 3943,5 | 3920,8 |
| Write imb_io_project | 293,2 | 412,6 | 524,1 | 386,6 |
| Write imb_io_scratch | 228,4 | 244,8 | 242,1 | 273,9 |
We observe from these tests that the bandwidth of the input/output operations is improved when the frequency limit is removed. We do not see a clear impact of enabling or disabling the HT.
These tests can be highly affected by the usage of the file systems during the job execution.
Conclusions
In all benchmarks, if the HT is enabled, the performance variance between multiple simulations is lower. Additionally, in all of the cases, when the HT is disabled and using 23 tasks per socket, it reduces the performance variance, and also in some cases we obtain a performance improvement. . In the case of Alya, despite using 23 tasks per socket or Hyperthreading, the noise is still high compared with other benchmarks.
In all benchmarks, the most common configuration used by the users (Def-24) is the one of the slowest in terms of performance. As Def-24 is a configuration without HT enabled and using 24 tasks per socket, it is the configuration with highest performance variance (noise).
Applications as NAMD and WRF have the best performance using hyperthreading and removing the frequency limit. Also, AMBER, CPMD and VASP, as we have seen on the HATE tests, have the best performance using this configuration. In these cases, we do not observe a clear impact of using 23 or 24 tasks per socket.
In the case of the I/O benchmarks, the bandwidth is higher if the frequency limit is removed, but it is not affected if the HT is enabled or disabled.


