HPC User Portal Guide
Table of Contents
HPC Portal ↩
With time, the management needs of our HPC users have been increasing. In order to centralize the information and administration of the majority of HPC related subjects, the BSC’s Support Team has developed a web platform containing a set of useful tools for HPC users and team leaders. The web platform is divided into two main applications that serve different purposes:
- HPC User Portal: job and resource monitoring of BSC’s HPC infrastructure.
- HPC Accounts Portal: management of users and projects.
In this document, we will do a quick overview of the functionalities of both applications.
Logging in ↩
You can locate both resources at this URL: https://hpcportal.bsc.es/
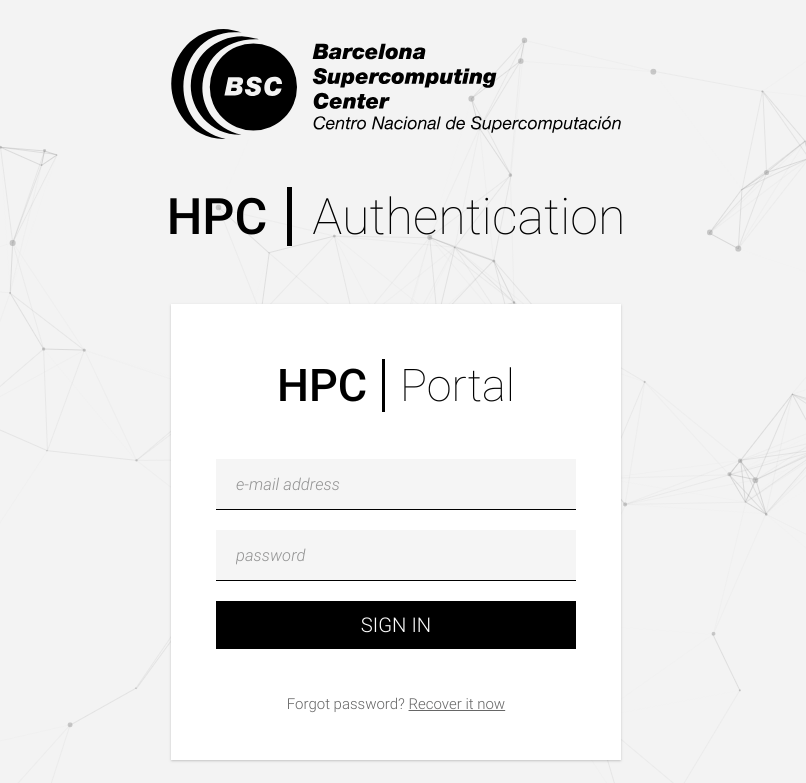
You will be greeted with the login screen. If you have never logged in before, you can request a password using the “forgot password” procedure. The only thing that will be requested is the e-mail address used for your BSC association. After filling the form, you will receive a e-mail containing an URL where you can set up your password.
With that out of the way, we can proceed to the next chapters, where we will see the main characteristics of the applications.
HPC Accounts Portal ↩
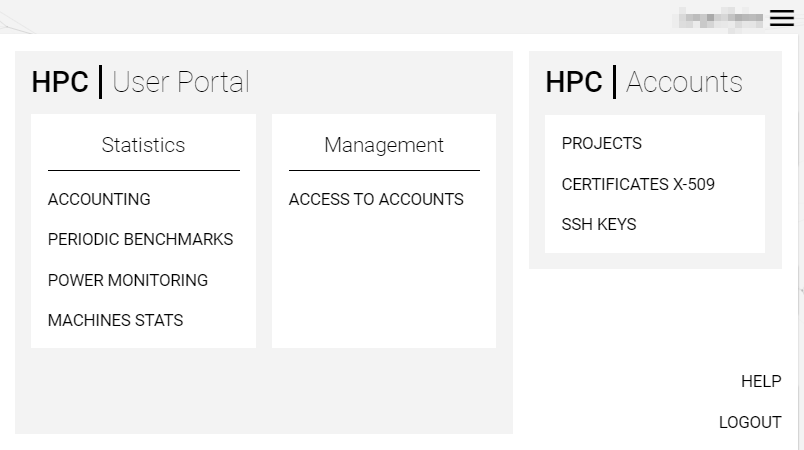
The HPC Accounts Portal is a project and HPC account management platform that is especially useful for PRACE users and BSC members. Its main purpose is to let users (and especially team leaders) check and manage their ongoing projects and the users associated with them. Here we will see its main functionalities, which can be accessed from the menu at the top right corner of the application:
Project and user management ↩
The most useful functionality of this portal is the centralization of the management of all ongoing projects that are related to PRACE or BSC. To give a demonstration, let’s see an example of what a team leader can do with this portal. Here we can see the default page of the portal, which is a list of all projects a team leader is related to:

Alongside a minimal list of each project’s most relevant information, we can also get a more extensive view of the project details using the “View” function. Here’s an example of that view:
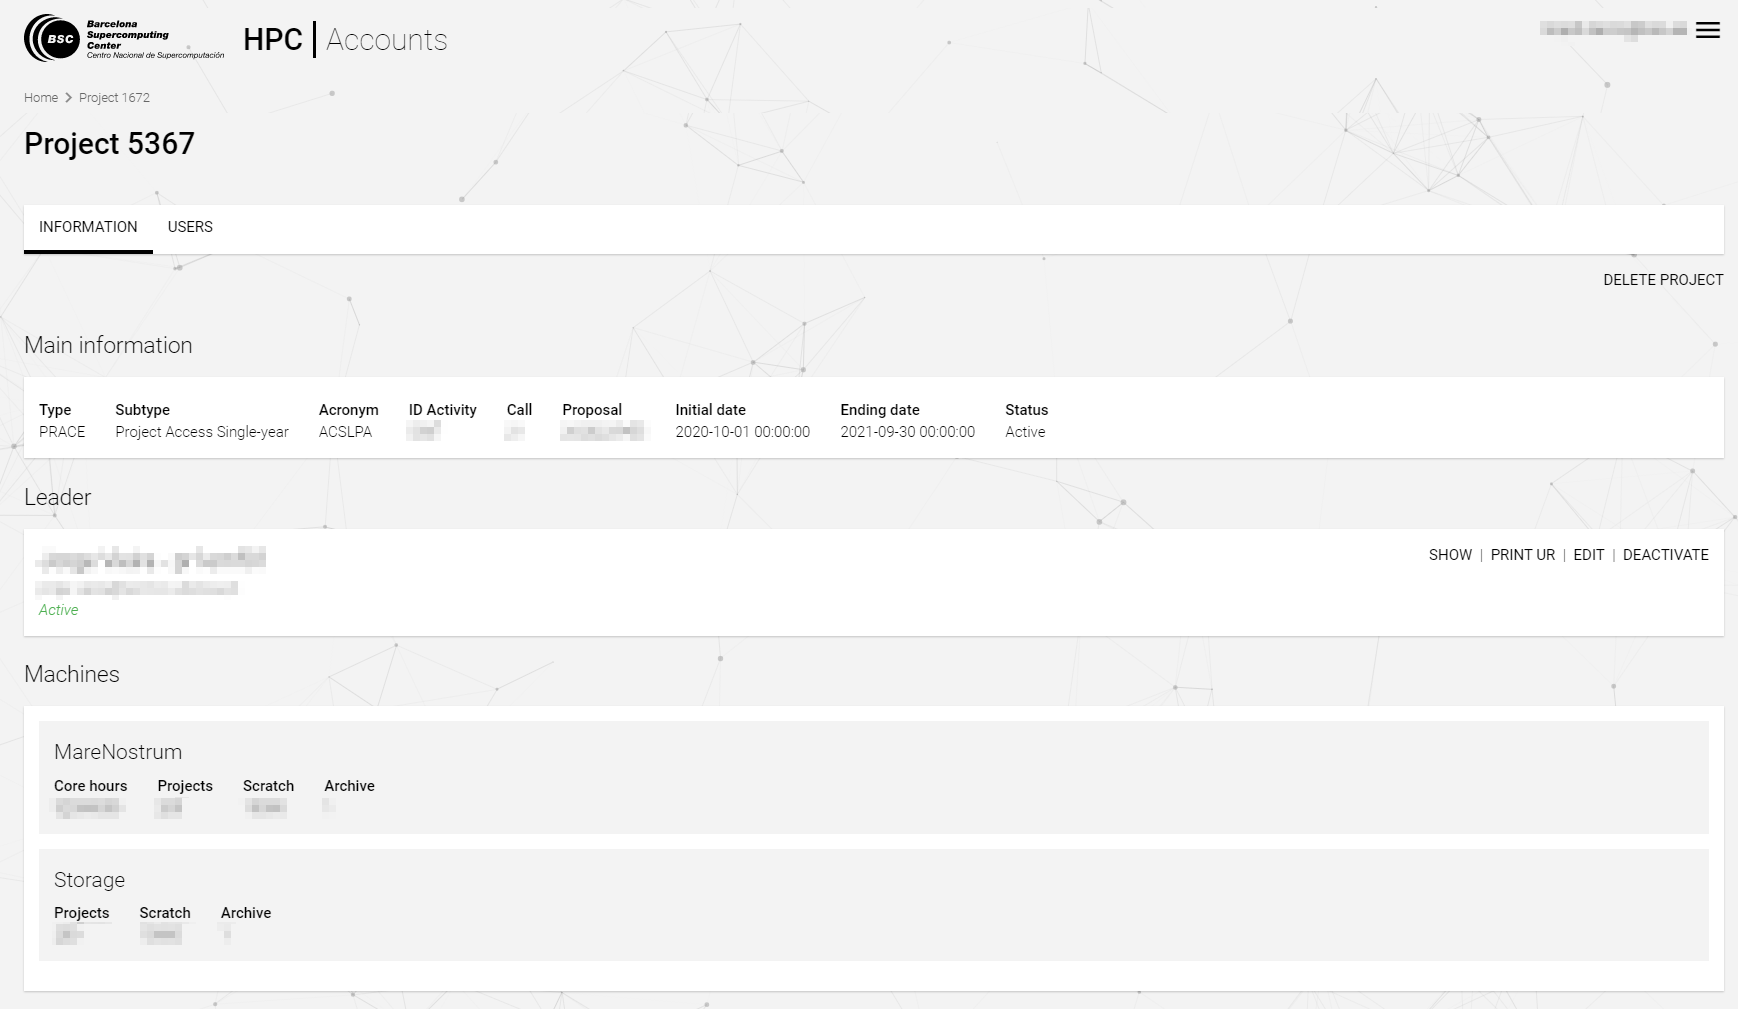
There are two main sections, “Information” and “Users”. The first one gives the main details about the project, such as the assigned leader and the HPC machines available (alongside the assigned computation hours and storage space for each one). The second one looks like this:
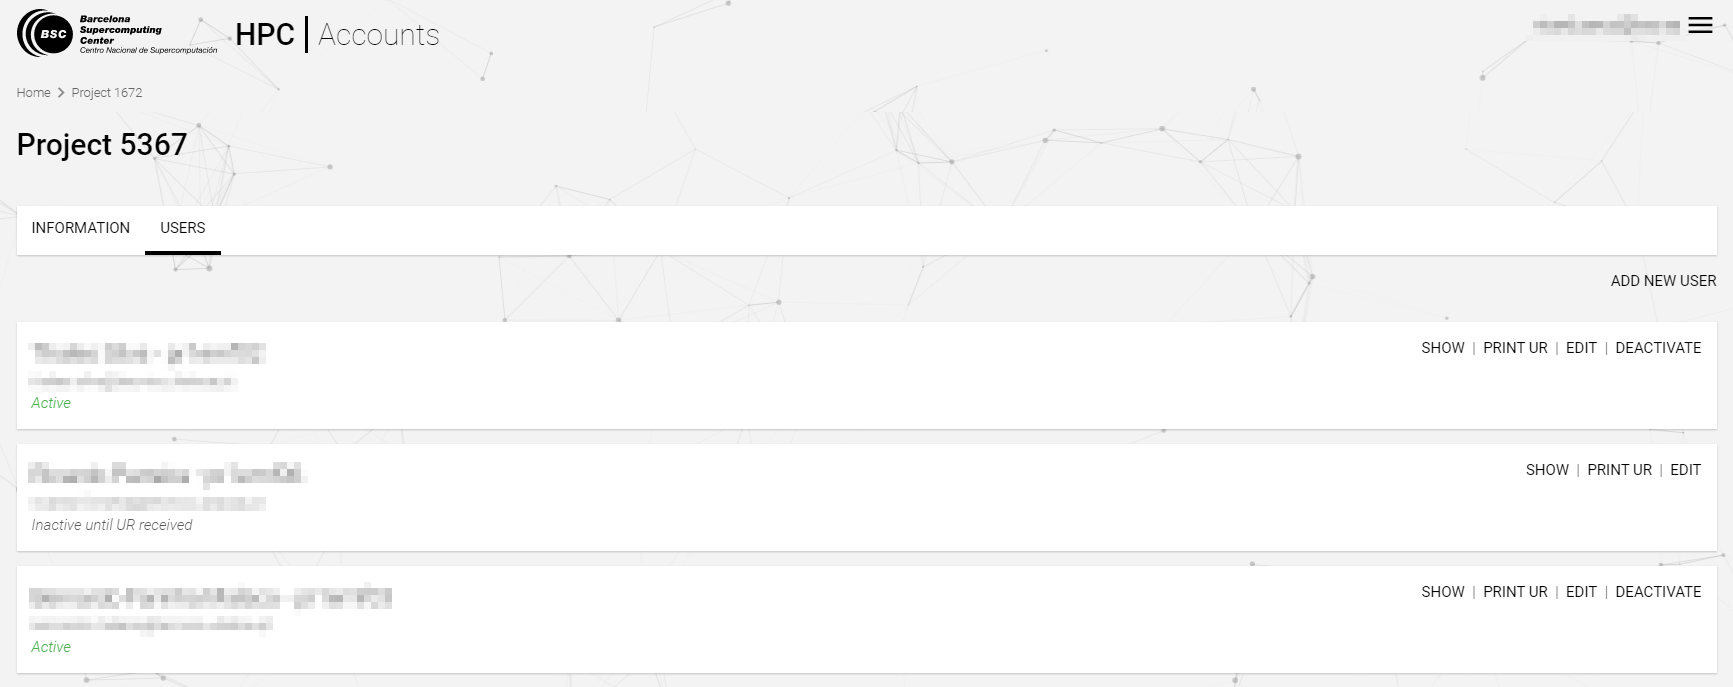
This section is specially important when managing users of a given project. From here, team leaders can check the state of the accounts of all users associated with the project. It also enables their administration with options such as the activation or deletion of HPC accounts, adding new users to the project and more. It is important for team leaders to be familiar with this section. If there are administration actions related to the project or its users that can’t be achieved through the use of this portal, you are always welcome to contact our Support Team (support@bsc.es).
SSH Keys ↩
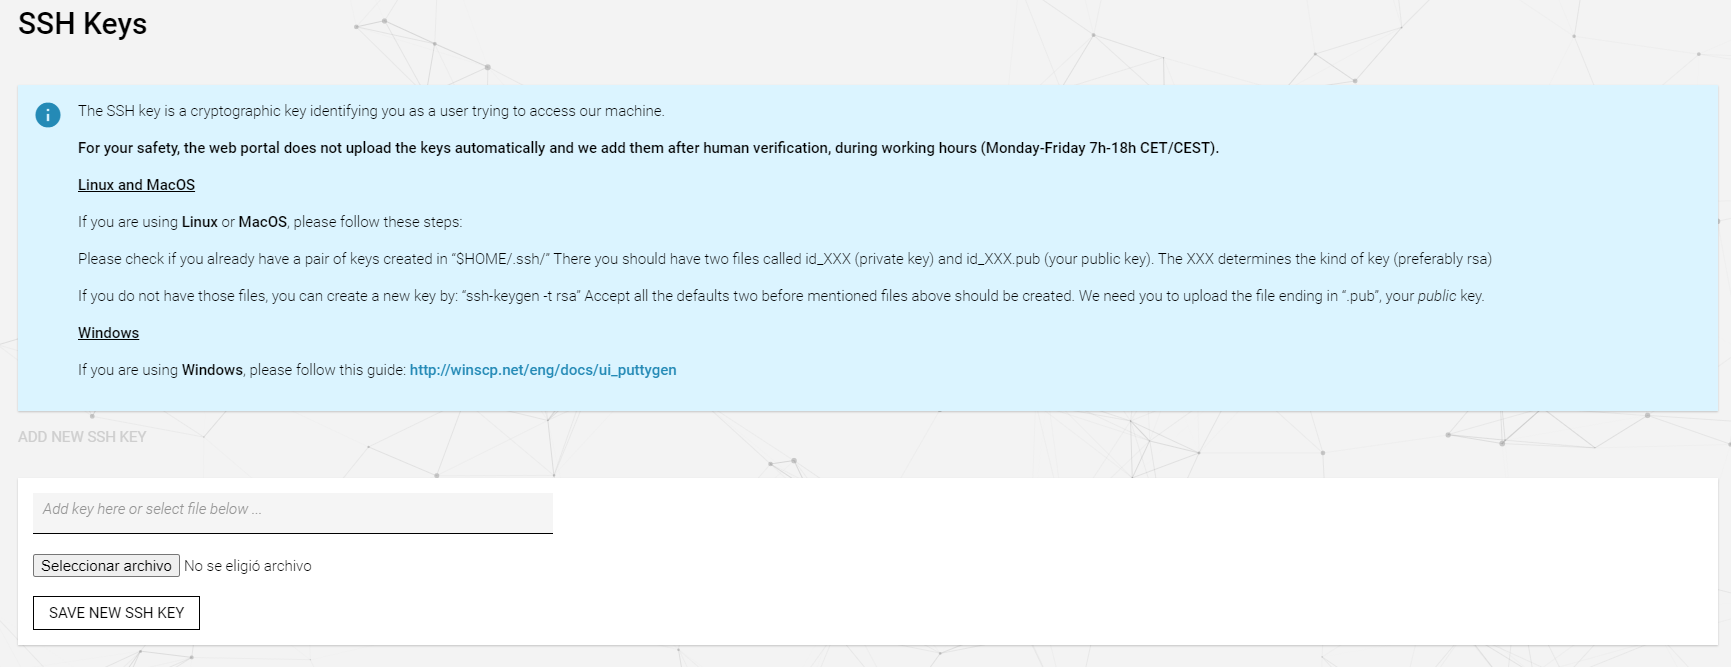
This section is specially important for PRACE users. PRACE-type accounts are only granted access to HPC machines through SSH keys, so they need to submit them through this system to be able to connect to any of our clusters. The interface is pretty simple, you can just select your desired keys from your system and upload them:
X–509 Certificates ↩
Similarly to the previous section, there is also an option to upload X.509 certificates. Again, they are specially useful to PRACE-type accounts, as it can enable features like the use of high-speed data connections between PRACE sites. Certificates can be uploaded the same way SSH keys are. Here’s an example of the function used to do so:

HPC User Portal ↩
The HPC User Portal is a job and resource monitoring platform developed with the HPC user’s needs in mind. With it, every HPC machine user can check the status and general resource usage metrics of the jobs launched. Alongside those functionalities, this system also provides historic machine stats (in terms of available and allocated CPUs) for the primary BSC machines. The platform is still growing, so it will progressively offer more information with time.
Before the implementation of this system, all users were required to contact support if they wanted to obtain resource usage metrics and information about their jobs. This procedure won’t be necessary anymore. This guide will explain how to use the portal and what it can do for you.
Job monitoring ↩
The main page of the HPC User Portal is the job monitoring screen. It will list all your jobs launched in all the machines by every account you have. This list contains a brief listing of the general characteristics of each job (like its name, user, status, node/task configuration…). If the job listed is in the “running” status, it will also show you the current CPU and memory usage.
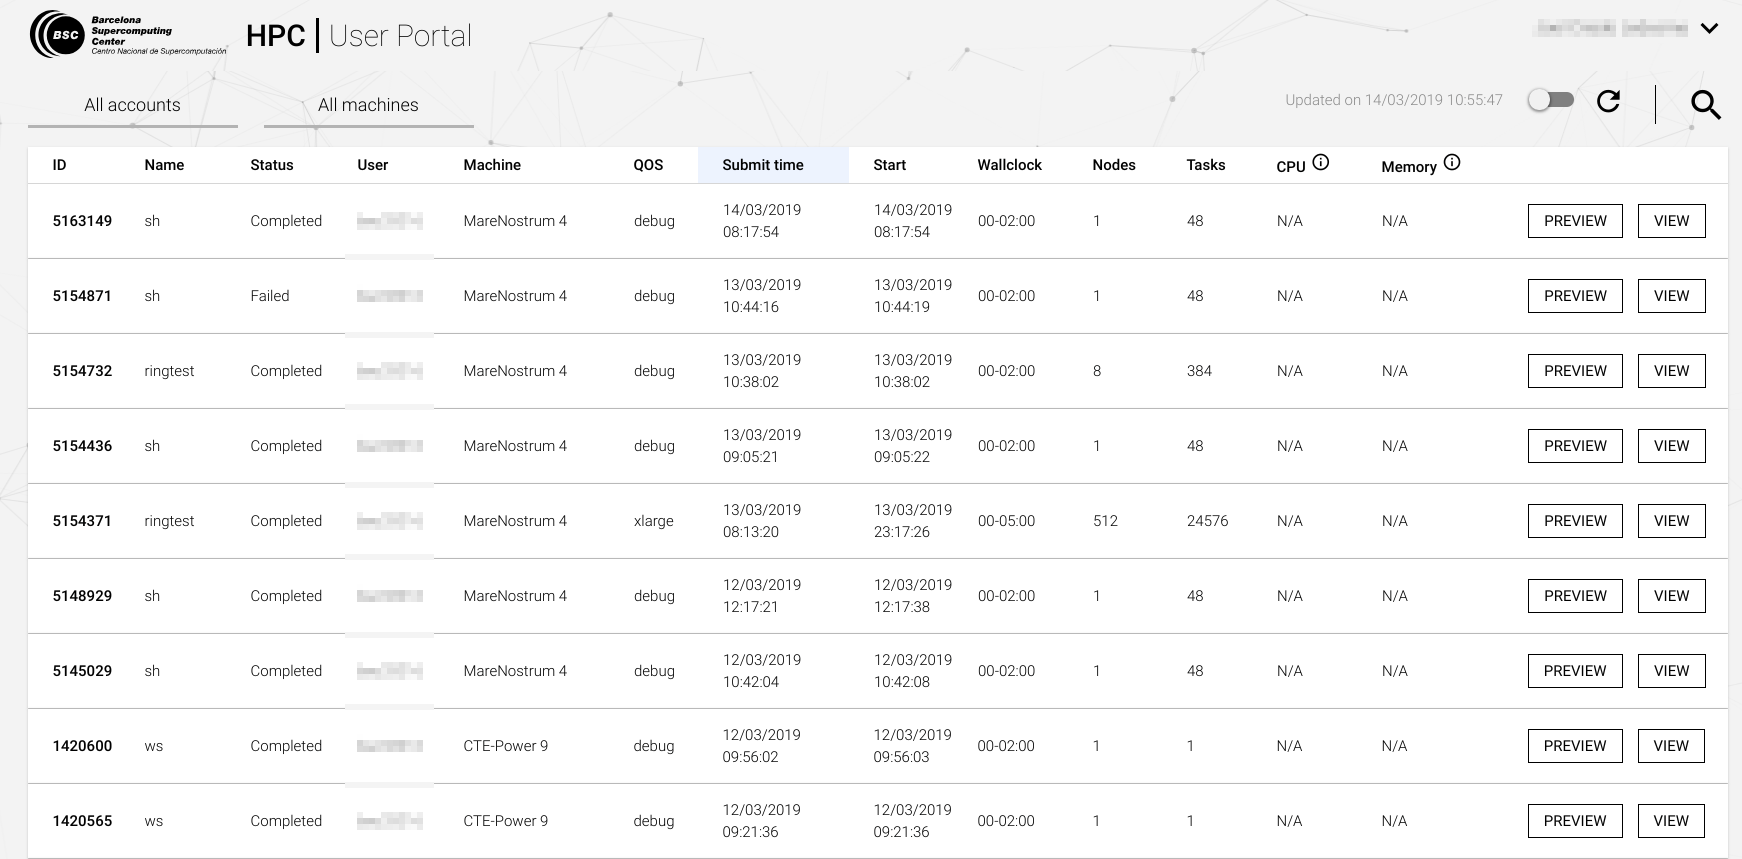
At first glance, it gives all jobs. The default settings don’t use any type of filtering. That can be changed using coarse filters or more specific search options. For example, you can list jobs that are launched on a specific machine by clicking on the “All machines” button and selecting the desired one. The same can be done with the “All accounts” button if you have more than one.
If your search needs more granularity, you can filter jobs by its characteristics using the search function located at the page’s top right corner. It will bring up a form where you can specify constraints such as job ID, job status, QOS or when were they launched.

Once the desired job is located, you can check its properties using either the preview button or the view button. The difference between them is the level of detail that they will give. The preview also uses a pop-up window instead of a full-blown page. We’ll skip the preview and show the “view” option directly, as it is just a subset of data. Here’s an example of a job:
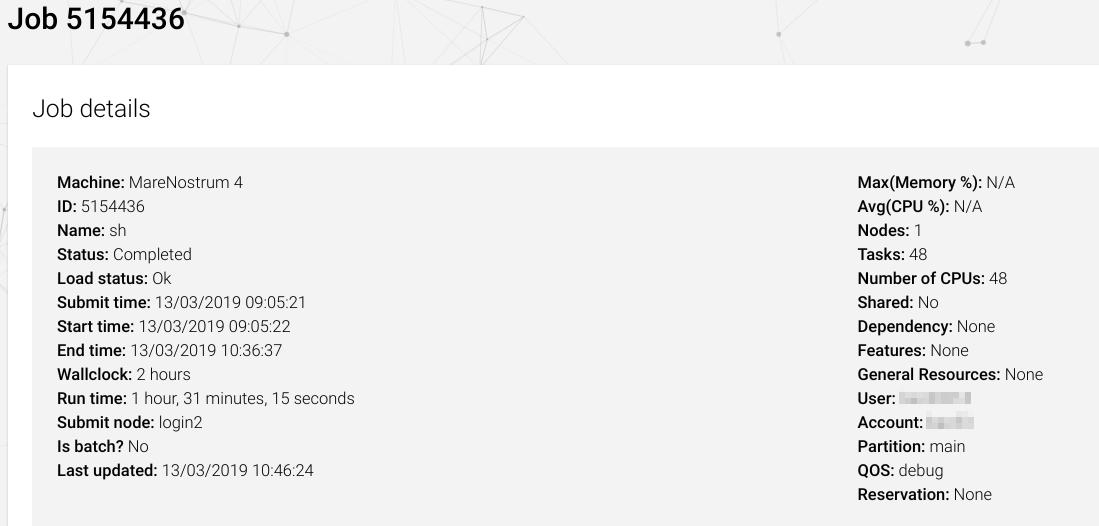
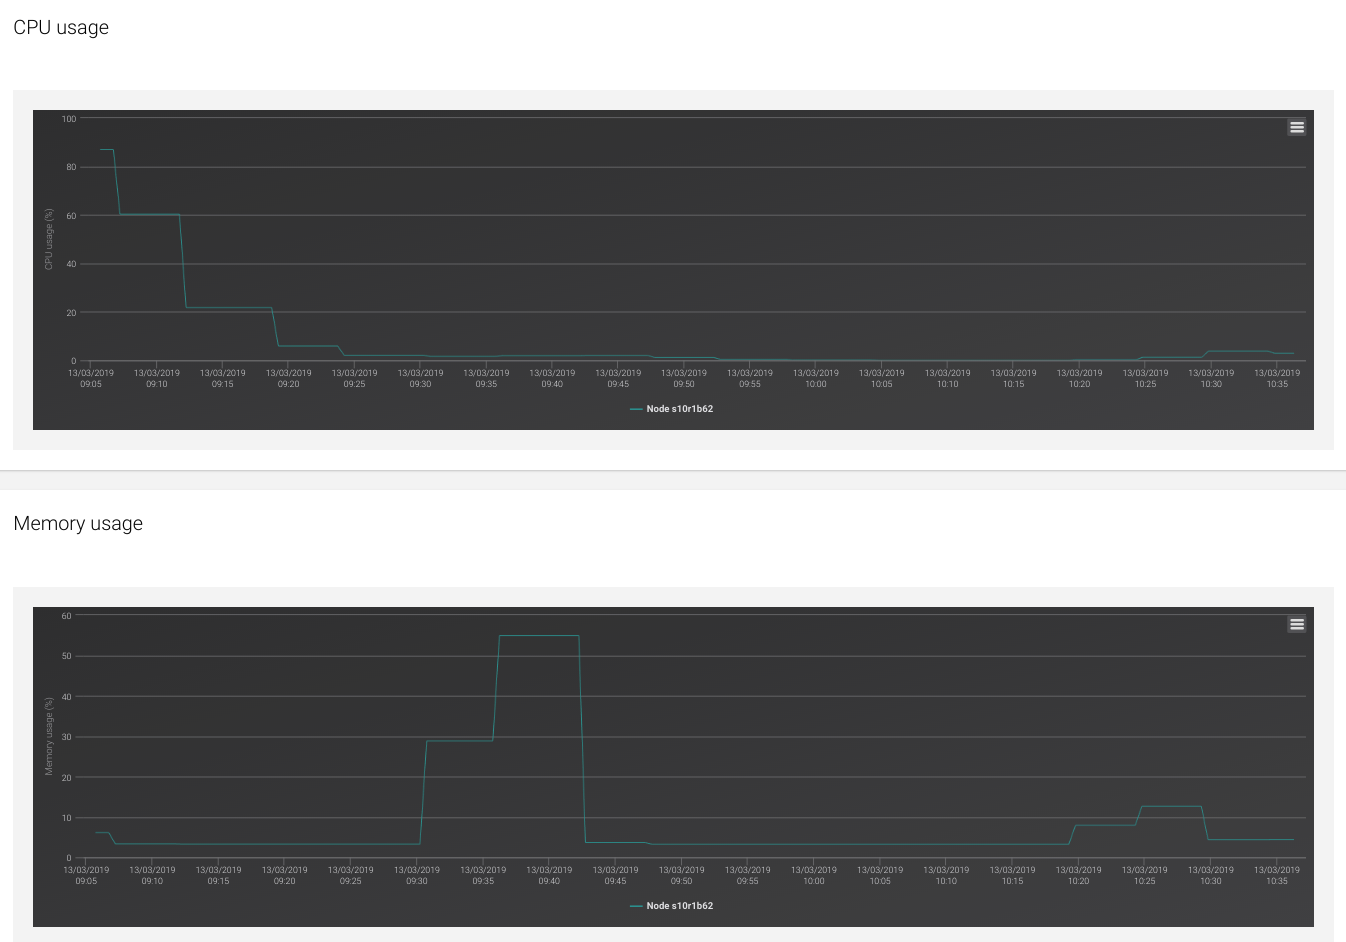

As you can see, the “view” function will give out specific details regarding the job execution. One of the most interesting features is the job metric histogram, which will show how the job has evolved during the time of its execution in terms of CPU usage, memory usage and power consumption. You can also download this information by clicking in the top right corner of each histogram and selecting your prefered format option (including the CSV format!).
This type of information used to be only accessible to support, which had to be specifically requested by the user. With this new system, the user can now quickly access this information.
Job notifications ↩
As we already explained in the user guides of our machines, there is a new functionality that will allow users to receive notifications regarding the state of their jobs. To enable it, you must add to the jobscript of your desired jobs the following directives:
#Definition of the directives
#SBATCH --mail-type=[begin|end|all|none]
#SBATCH --mail-user=<your_email>

#Fictional example (notified at the end of the job execution):
#SBATCH --mail-type=end
#SBATCH --mail-user=dannydevito@bsc.es
Those two directives are presented as a set because they need to be used at the same time. They will enable e-mail notifications that are triggered when a job starts its execution (begin), ends its execution (end) or both (all). The “none” option doesn’t trigger any e-mail, it is the same as not putting the directives. The only requisite is that the e-mail specified is valid and also the same one that you use for the HPC User Portal.
Maintenance and Machine Status ↩
The standard procedure for notifying machine maintenance dates and incidences was (and still is) sending e-mails to all the affected users. Some users may feel that keeping in mind all the dates is a bit burdensome. Knowing this, the HPC User Portal has included a section where you can keep track of the current operative status of all the machines, alongside all the scheduled maintenances and undergoing system issues that may occur. You can access it in the dropdown menu located at the top right corner of the page, next to your user name. Here’s how it looks:
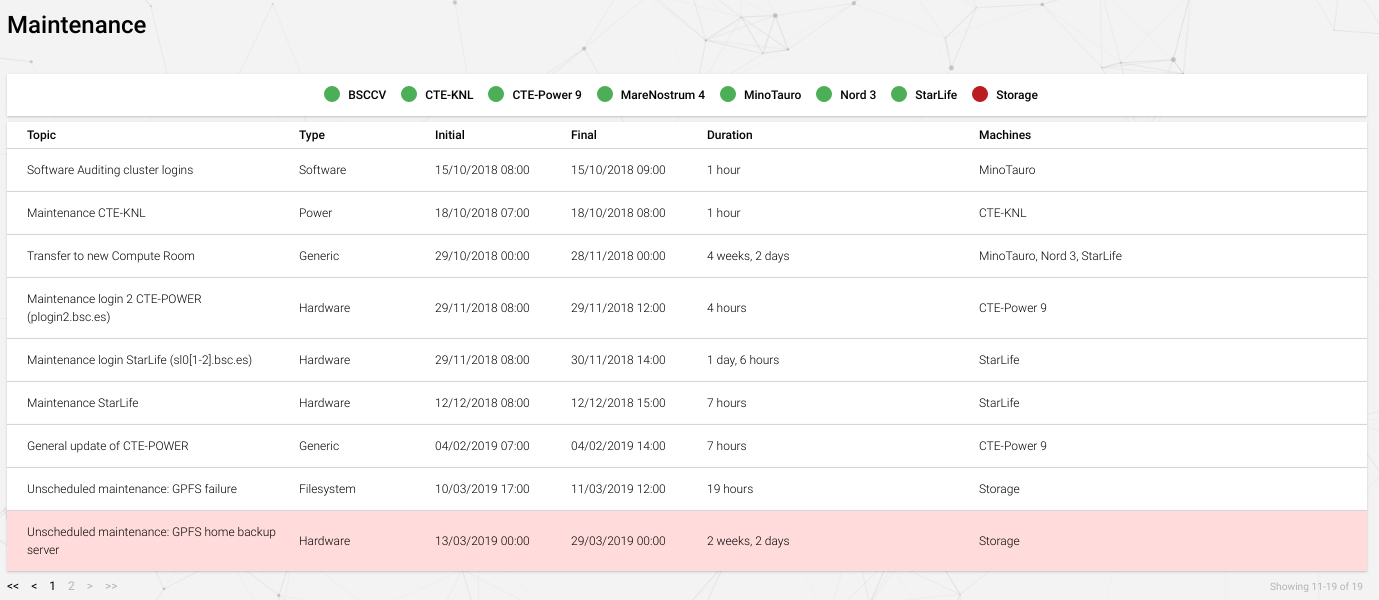
As you can see, it lists all scheduled and past maintenances, specifying the machines affected and the estimated time that they will (or did) last. The initial row lists all the machines with their associated status color. Green means that the machine is not affected by any maintenance or issues. Otherwise, the color will be red.
Accounting ↩
Each user can also check how much CPU time has used in each machine over the course of a defined time period. You can access the accounting page through the same menu you used to access the maintenance stats. You will need to specify which account and which machine to display, giving also a start and end date. Here’s how it looks:
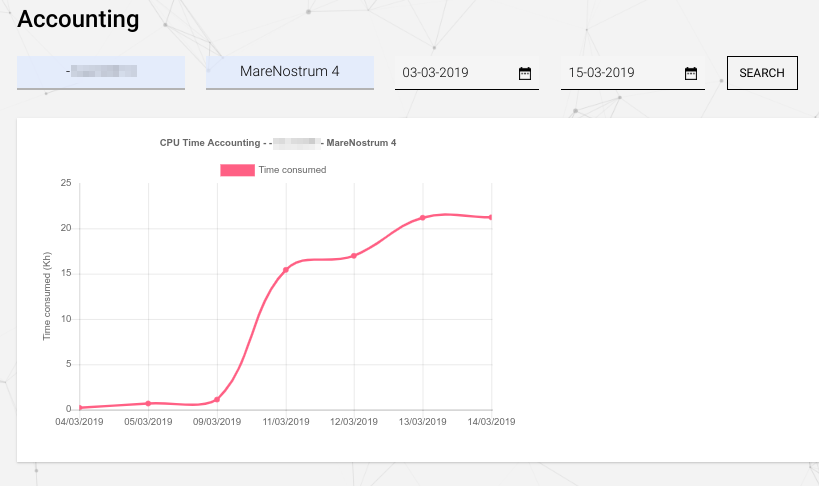
Each point in the diagram can be checked to give the exact amount of time spent that day. For regular users, the data given is restricted to its own accounts. If you are a responsible or team leader, you can also check the accounting of all your group members, as well as the whole group acounting. This can be used as a monitoring tool to keep the group CPU time usage in check.
It’s important to note that if there isn’t any relevant time consumption in the specified range of days, the portal might not be able to generate a diagram, as it won’t have the required time consumption data.
Machine statistics ↩
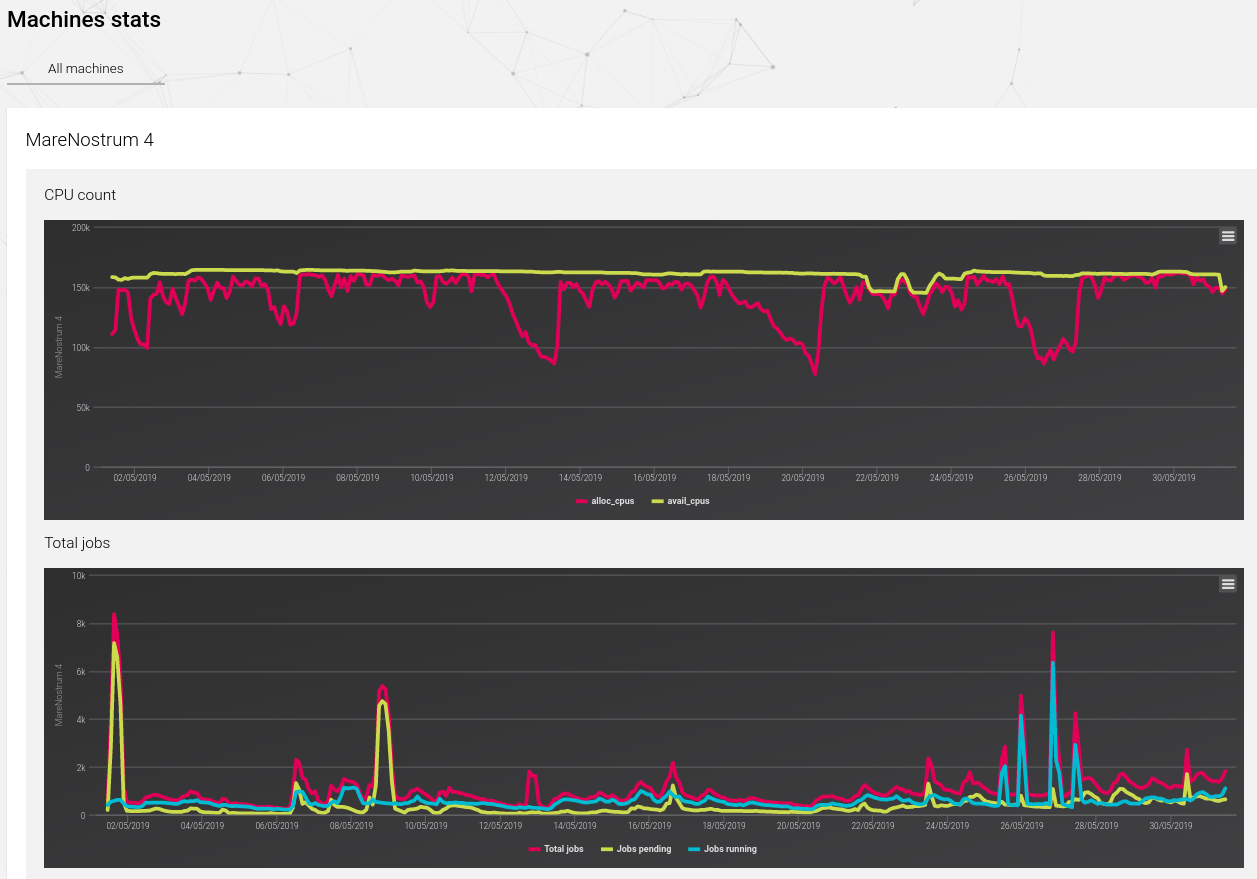
One of the most recent additions is the “Machines Stats” tab, where you can check a chronological diagram of the global resource usage of the machines in terms of CPU allocation, jobs and queues status. This way, every user can check the general usage and state of the machine in a given time.
Here we can see an example of the diagrams:
Periodic benchmarks ↩
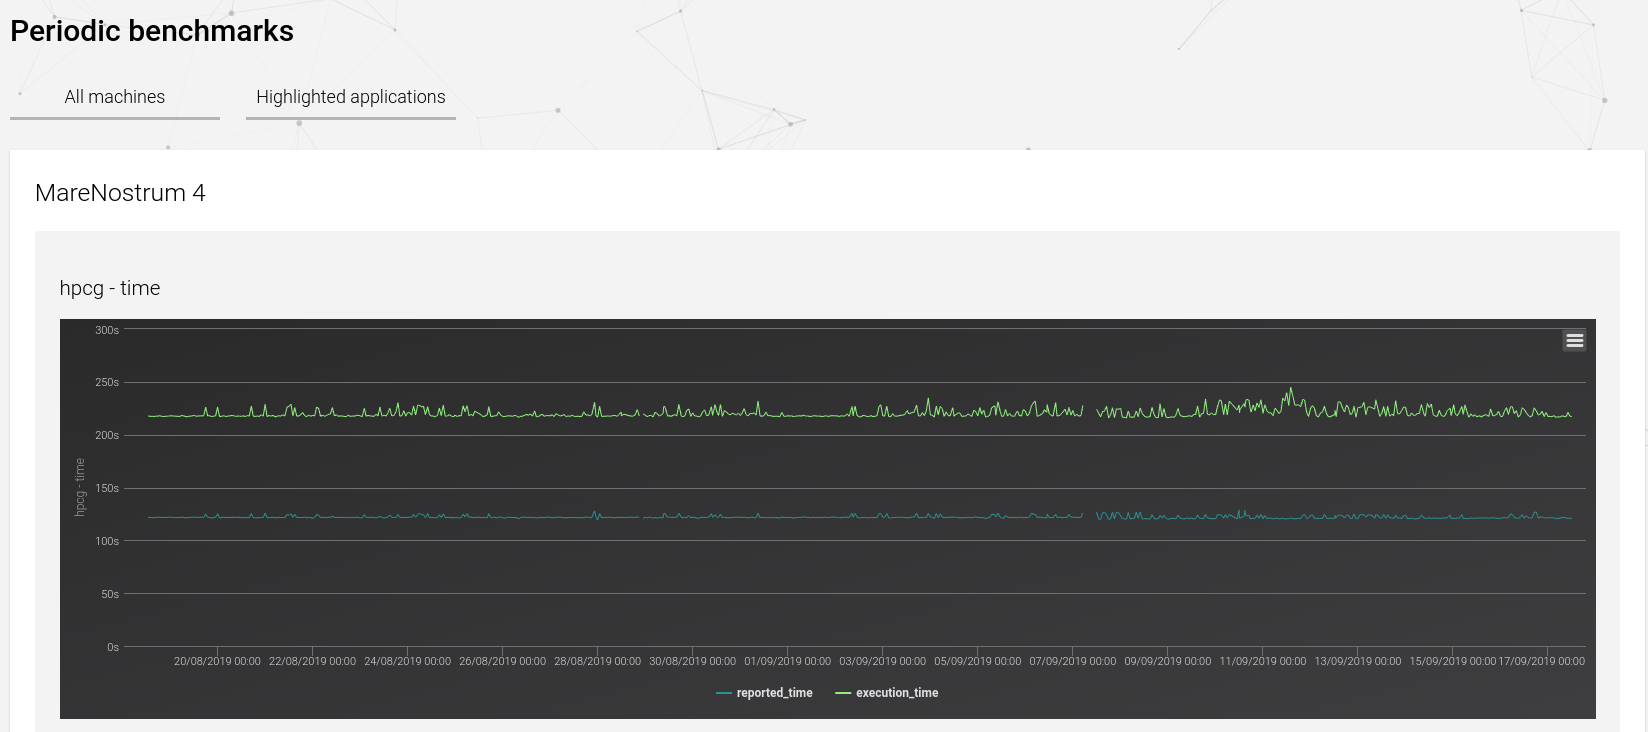
One useful feature of the portal is the visualization of historical data of the performance metrics of various programs which are used as benchmarks. Those benchmarks are run several times each day. The goal of this system is to be able to track down system issues that may be slowing down the HPC machines.
This is the list of software used for benchmarking purposes:
- Alya
- Amber
- CPMD
- Gromacs
- HPCG
- HPCG (GPU version)
- Imb_io
- Linpack
- Linpack (GPU version)
- Namd
- Vasp
- WRF
And finally, here’s an example of the feature:
